
Four S&P Index Strategies.
Four Very Different Outcomes.
Seeing “S&P” in the name of a fixed indexed annuity strategy does not tell you how that strategy will perform.
I have spent 44 years working with annuities, and one thing I've learned is that familiar names can sometimes create a false sense of simplicity.
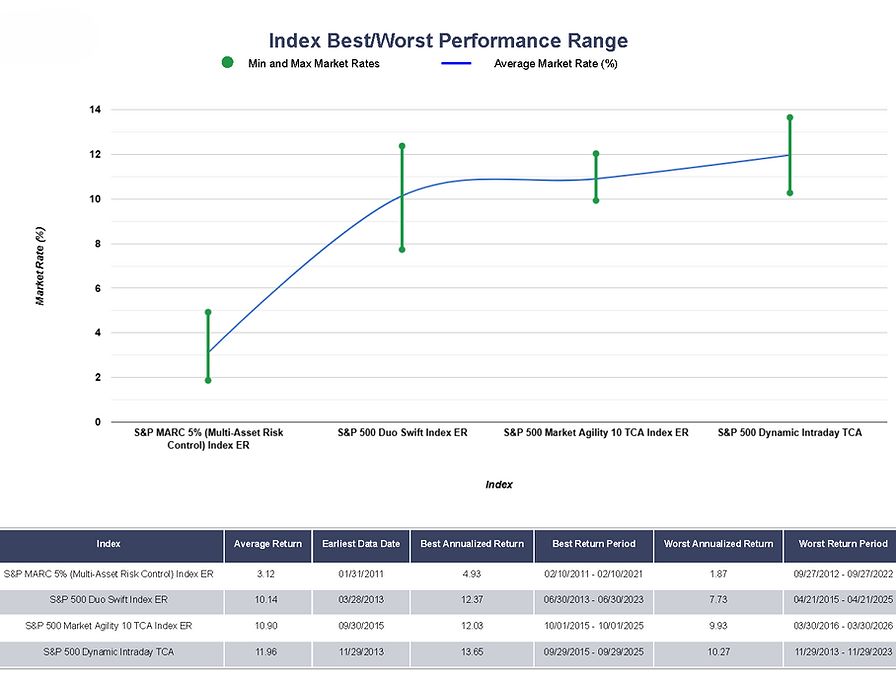
Look at the historical comparison above.
Four indices. Every one has S&P in the name.
Yet the illustration reports ten-year average historical returns of:
-
3.12% for the S&P MARC 5%
-
10.14% for the S&P 500 Duo Swift
-
10.90% for the S&P Market Agility 10
-
11.96% for the S&P 500 Dynamic Intraday
That's a very big difference. Three of the indexes averaged over 10%. One averaged closer to 3%.
Why?
Because “S&P” doesn't mean all of these strategies are simply tracking the traditional S&P 500.
These are different index methodologies. S&P describes MARC 5%, for example, as a multi-asset index incorporating equities, commodities and fixed income.
The S&P 500 Duo Swift Index uses an intraday risk-control mechanism that can adjust its equity exposure. And there is another layer.
In an FIA, the index itself is only part of the story. The annuity's crediting terms determine how index performance translates into interest credited to the contract.
So when comparing two fixed indexed annuities, don't stop at:
“Does it have an S&P strategy?”
Ask:
-
Which S&P index?
-
How does that index work?
-
What are the current crediting terms?
-
And what would have to happen for the strategy to actually credit interest?
Understanding their annuity's crediting strategies is part of what I believe an annuity buyer deserves. That often only comes from having an annuity advisor that understands the nuances.